Comparing energy scenarios by means of ternary diagrams

Titolo Rivista ECONOMICS AND POLICY OF ENERGY AND THE ENVIRONMENT
Autori/Curatori Chiara Bustreo, Guido Meneghini, Carlo Petrocvich, Irene Vignotto, Giuseppe Zollino
Anno di pubblicazione 2016 Fascicolo 2015/1
Lingua Inglese Numero pagine 17 P. 71-87 Dimensione file 261 KB
DOI 10.3280/EFE2015-001006
Il DOI è il codice a barre della proprietà intellettuale: per saperne di più clicca qui

Qui sotto puoi vedere in anteprima la prima pagina di questo articolo.

Se questo articolo ti interessa, lo puoi acquistare (e scaricare in formato pdf) seguendo le facili indicazioni per acquistare il download credit. Acquista Download Credits per scaricare questo Articolo in formato PDF
Anteprima articolo

FrancoAngeli è membro della Publishers International Linking Association, Inc (PILA)associazione indipendente e non profit per facilitare (attraverso i servizi tecnologici implementati da CrossRef.org) l’accesso degli studiosi ai contenuti digitali nelle pubblicazioni professionali e scientifiche

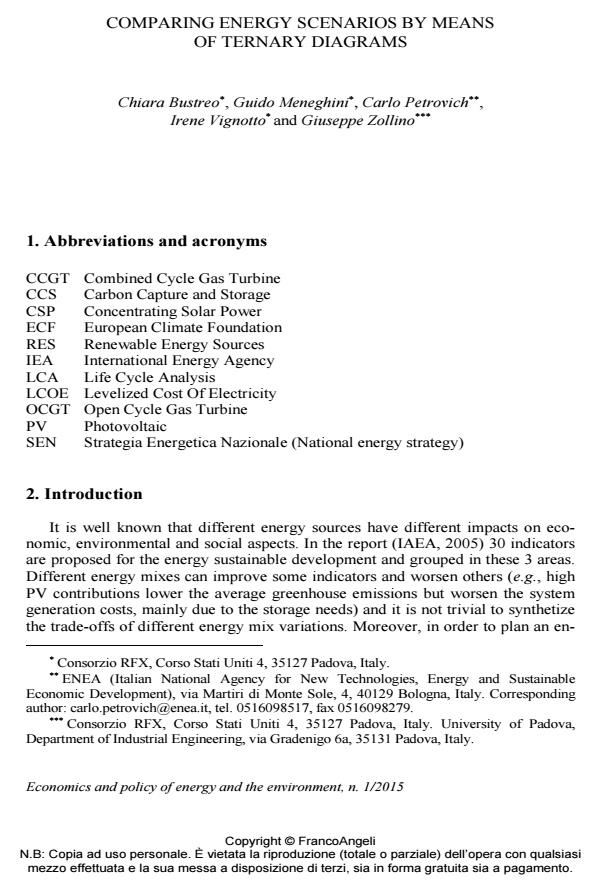
The use of ternary diagrams is here proposed as a straightforward means to show the relation between the electricity generating mixes and relevant scenario parameters, such as system carbon emissions (gCO2/kWh) and generation costs (c€/kWh). The effectiveness of the representation is improved by plotting contour lines inside the diagram to help the reader to identify the generation mixes that meet specific economic and environmental requirements. Along with the description of the potentiality of the ternary diagrams in the energy scenario field, an explanatory application is also reported. It demonstrates the helpfulness of the graph in performing preliminary assessments of specific energy policies. The levelized cost of electricity (LCOE) of a future (2030) Italian electricity generation system largely based on renewables - providing 50% of the demand - is plotted in a ternary diagram as function of the combination of different renewable electricity generation shares. The graph clearly shows that the cheapest electricity can be achieved by an electricity generation mix that covers 20-30% of the electricity demand with wind power, 0-20% with photovoltaic (PV) and 10-30% with the other renewables. Further assessments demonstrate that the PV capacity should be limited so as to reduce the installation of expensive energy storage capacity while wind power along with electricity from biomass could effectively contribute in reducing the system LCOE.

Keywords:Energy scenarios, renewables, Italian energy policy, ternary diagram

Jel codes:O21, Q48

  1. AEEG (2013). Relazione annuale sullo stato dei servizi e sull’attività svolta. Milano: Autorità per l’energia elettrica e il gas.
  2. Almeida C., Barrella F. and Giannetti B. (2004). Graphical tool for emergy analysis: concepts and an example of application, in Proceedings of IV Biennial International Workshop “Advances in Energy Studies”, 361-372, Campinas, SP. Brazil.
  3. Bustreo et al., under submission for publication in Energy Policy. The COMESE code for the analysis of a future Italian energy system largely based on renewables.
  4. Contaldi M., Pantaleoni M., Condor R.D., Gonella B. and Vitullo M. (2011). 2011 Italy Climate Policy Progress Report, 142/2011. Roma: ISPRA.
  5. Devezas T., LePoire D., Matias J. and Silva A. (2008). Energy scenarios: Toward a new energy paradigm. Futures, 40: 1-16. DOI: 10.1016/j.futures.2007.06.005
  6. ETP (2008). Energy Technology Perspectives – Scenarios & Strategies to 2050. Paris: OECD/IEA.
  7. EU (2011). A Roadmap for moving to a competitive low carbon economy in 2050, European Commission.
  8. European Climate Foundation (2010). Roadmap 2050: a practical guide to a prosperous, low-carbon Europe.
  9. Eurostat (2012). Energy, transport and environment indicators. Luxembourg: European Union.
  10. FP7 (2013). ACQWA – Assessing the future of water resources in vulnerable mountain regions, European Project.
  11. German Aerospace Center (DLR) (2005). Concentrating Solar Power for the Mediterranean Region, Final report. Stuttgart.
  12. Governo Italiano (2013). Strategia Energetica Nazionale: per un’energia più competitiva e sostenibile.
  13. Graham D. and Midgley N. (2000). Graphical representation of particle shape using triangular diagrams: an Excel spreadsheet method. Earth Surface Processes and Landforms, 25(13): 1473-1477. DOI: 10.1002/1096-9837(200012)25:13<1473::aid-esp158>3.0.co;2-c
  14. GSE (2011). Rapporto Statistico UE 27 – Settore Elettrico.
  15. GSE (2012). Rapporto Statistico 2011 – Impianti a fonti rinnovabili.
  16. IAEA (2005). Energy Indicators for Sustainable Development: Guidelines and Methodologies. Wien: IAEA.
  17. IEA (2002). Potential for Building Integrated Photovoltaic, Report IEA-PVPS T7-4 (Summary). Switzerland: IEA.
  18. IEA (2010). Projected Costs of Generating Electricity. Paris: OECD/NEA/IEA.
  19. IEA (2012a). Key World Energy STATISTICS. Paris: OECD/IEA.
  20. IEA (2012b). World Energy Outlook 2012. Paris: OECD/IEA.
  21. IEA (2012c). Energy Technology Perspectives 2012. Paris: OECD/IEA.
  22. ISPRA (2012). Fattori di emissione di CO2 nel settore elettrico e analisi della decomposizione delle emissioni, 172/2012. Roma: ISPRA.
  23. Lanati F. and Gelmini A. (2010). SUSPLAN D2.7 Report from the regional case study: Southern Europe (Italy).
  24. Meier P. (2002). Life-Cycle Assessment of Electricity Generation Systems and Applications for Climate Change Policy Analysis, UWFDM-1181. Wisconsin: University of Wisconsin.
  25. Moomaw W., Burgherr P., Heat G., Lenzen M., Nyboer J. and Verbgruggen A. (2011). Annex II: Methodology. In IPCC Special Report on Renewable Energy Sources and Climate Change Mitigation. Cambridge (UK) and New York: Cambridge University Press.
  26. Motola V., Colonna N., Alfano V., Gaeta M., Sasso S., De Luca V., De Angelis C., Soda A. and Braccio G. (2009). Censimento potenziale energetico biomasse, metodo indagine, atlante biomasse su WEB-GIS, Report RSE/2009/167.
  27. NEA (2012). Nuclear Energy Today, No. 6885. Paris: NEA/OECD.
  28. OECD/IEA (2012). Golden Rules for a Golden Age of Gas, Paris: OECD/IEA.
  29. Sandrock C. (2007). Ternplot, http://www.mathworks.com/matlabcentral/fileexchange/2299-ternplot.
  30. TERNA (2012). TERNA, Dati statistici. http://www.terna.it/default/Home/SISTEMA_ ELETTRICO/statistiche/dati_statistici.aspx.
  31. WNA (2011). Comparison of Lifecycle Greenhouse Gas Emissions of Various Electricity Generation Sources. London: WNA Report.

Chiara Bustreo, Guido Meneghini, Carlo Petrocvich, Irene Vignotto, Giuseppe Zollino, Comparing energy scenarios by means of ternary diagrams in "ECONOMICS AND POLICY OF ENERGY AND THE ENVIRONMENT" 1/2015, pp 71-87, DOI: 10.3280/EFE2015-001006